Progress
This documents both the evolution of the visualization, as well as (at least in
the beginning), my learning d3.js.
February 18, 2012
First day with d3.js, using a fake dataset that contains the following
calls:
| Function | Start time | End time |
|---|---|---|
main |
0 |
50 |
foo |
1 |
8 |
bar |
10 |
38 |
baz |
11 |
12 |
baz |
13 |
14 |
fizz |
18 |
32 |
cleanup |
39 |
45 |
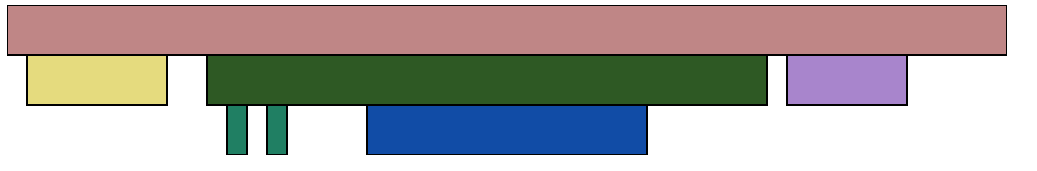
Image:
Basic (read: ugly) rendering of the shapes works. They’re all the same color, and have no labels or interactivity.
February 21, 2012
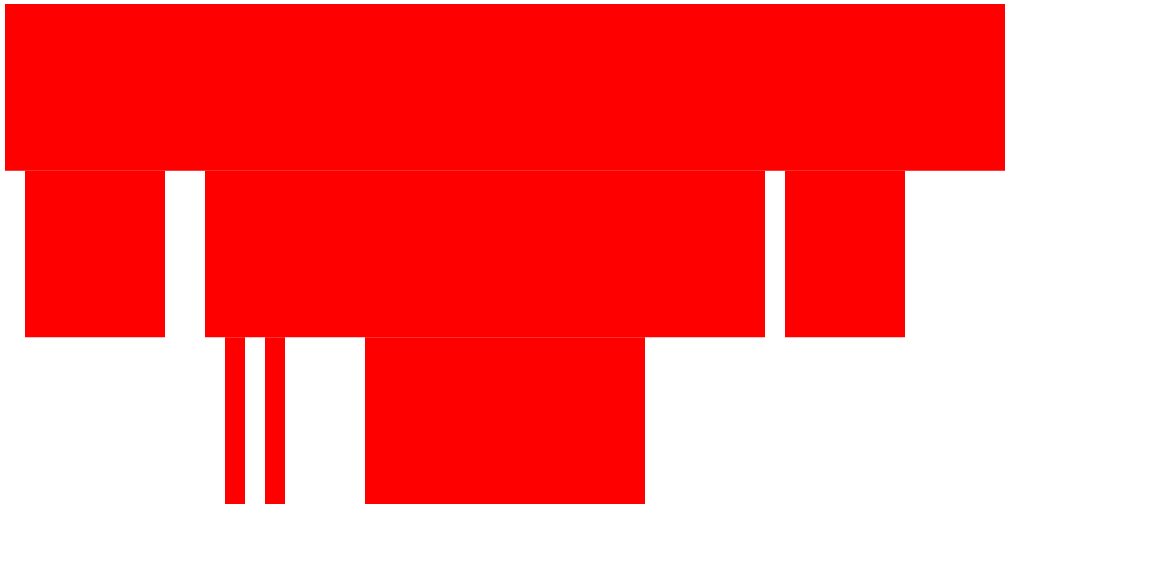
After learning far more about color systems than I ever intended I now have working coloring for different calls. I also played with the sizing so it looks a bit more sane, added a stroke to make it look nicer, and a simple mouseover effect. As a result of all my work on learning HSV this also resulted in a patch for d3.js to add HSV support.
Image: